
₹1,68,622 revenue
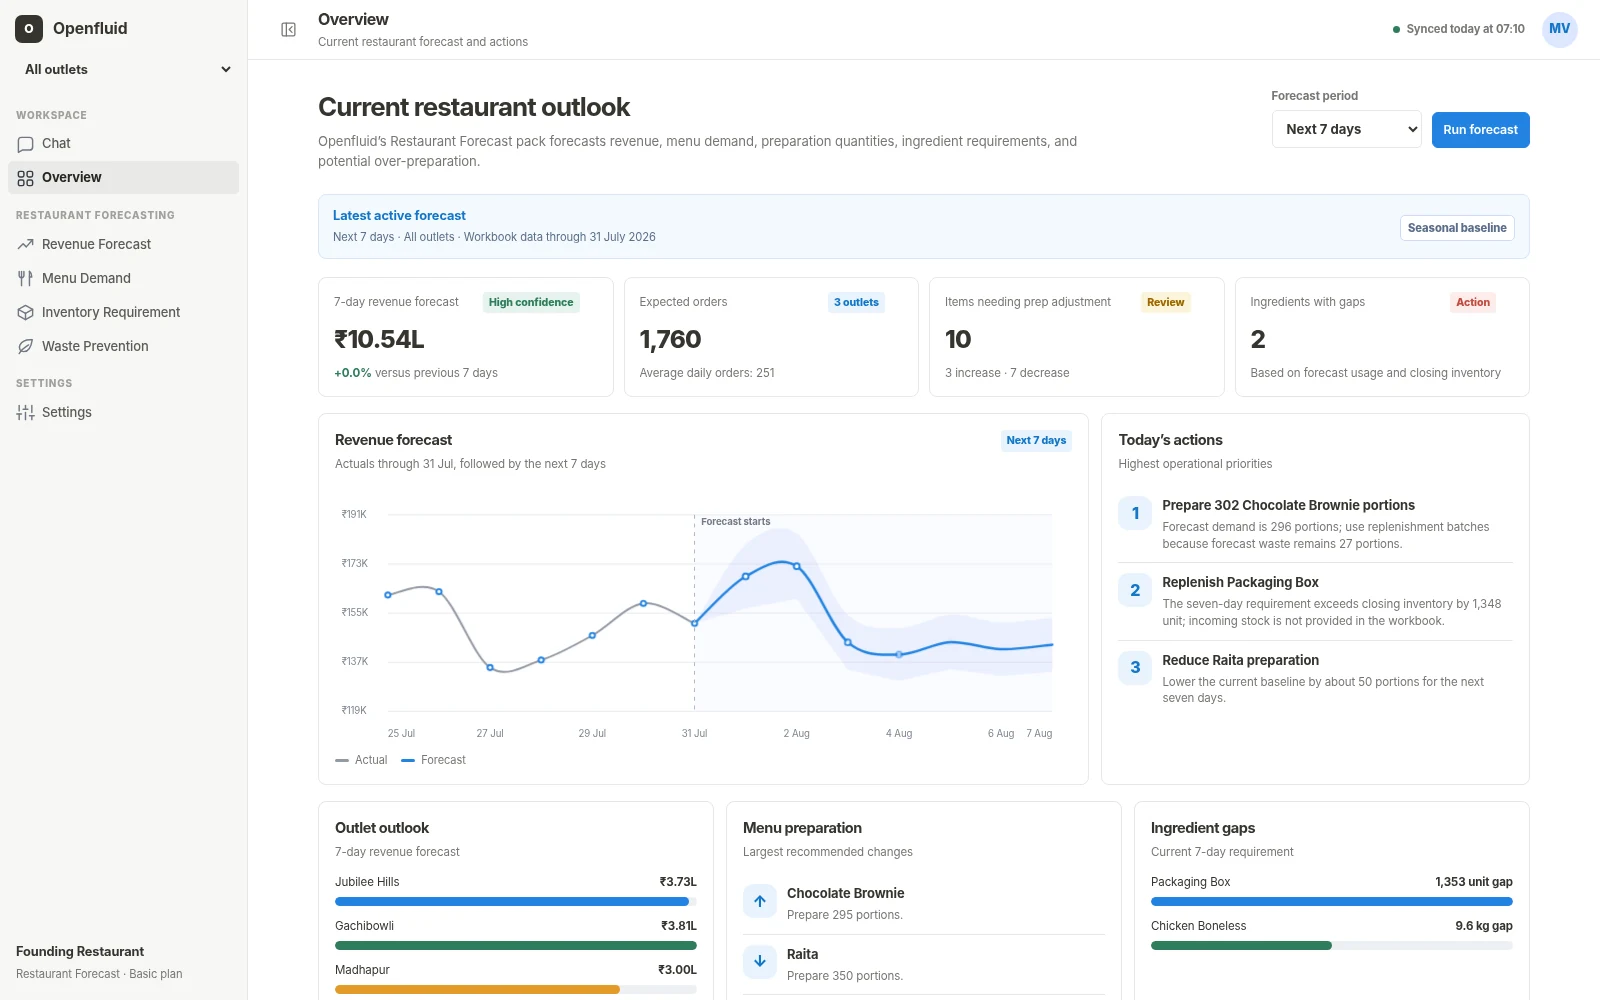
The seasonal baseline estimates about 281 completed orders across the three outlets. Jubilee Hills leads revenue; Gachibowli leads orders.
Sales become item demand. Item demand becomes preparation. Recipes turn preparation into ingredients. Closing stock exposes the gap. Recorded waste tells the team whether the plan improved.
The value comes from carrying the same outlet, item, date and unit definitions through the entire chain. Separate forecasts that use different grains create reconciliation work.
These values come from the synthetic TimesFM input workbook used in the prototype. They illustrate the decision flow, not commercial performance.
The seasonal baseline estimates about 281 completed orders across the three outlets. Jubilee Hills leads revenue; Gachibowli leads orders.
Rounded outlet forecasts are 40 portions at Jubilee Hills, 38 at Gachibowli and 37 at Madhapur. The kitchen can then add an explicit service buffer.
Jubilee Hills shows roughly 517 boxes required over seven days against 12 recorded at close. The recommendation still needs pack size, delivery lead time and open purchase orders.
Chicken Dum Biryani had the highest recorded waste quantity in the latest week. That observation informs the buffer; it does not prove the forecast caused the waste.
The product should not imply that a POS contains recipes, stock counts or actual waste. Those inputs often come from kitchen, inventory or procurement workflows.
| Decision | Minimum input | Better with | Output |
|---|---|---|---|
| Revenue | Completed orders, net revenue, outlet and timestamp | Channel, promotion and closure calendar | Revenue and order range by day/outlet |
| Menu demand | Order-line quantity and menu item | Daypart, availability and substitution events | Item forecast and preparation baseline |
| Ingredients | Recipe quantity and item forecast | Yield, wastage factor, pack size and lead time | Requirement, gap and purchase priority |
| Waste prevention | Preparation baseline and demand forecast | Actual leftovers, spoilage and plate-waste logs | Potential excess and measured outcome |
A narrower claim makes the product easier to trust and easier to evaluate during a pilot.
Accuracy depends on data quality, event coverage, the chosen horizon and whether operators use the result in time.
Spoilage, trim, cooking loss, plate waste and leftovers require direct measurement; sales history cannot reconstruct them reliably.
Vendor lead time, minimum order, open orders, pack size, shelf life and approval rules are needed before ordering.
Yes for revenue, order and item-demand forecasting. Ingredient requirements and measured waste need recipes, stock and operational records.
No. Outlets can share a modelling framework while retaining their own demand level, weekly pattern, events and operating constraints.
Use rolling historical backtests for accuracy, then track whether the approved plan improved stockouts, sell-through, excess or planning time during live operation.
Revenue is the easiest starting point. Preparation or inventory usually creates more operational value when the necessary data is available.