
Potential over-preparation
The difference between the current preparation baseline and the new recommended preparation quantity. This is an opportunity estimate, not proof that waste occurred.
Openfluid compares expected demand with the quantity you plan to prepare. It highlights over-preparation risk before service, while keeping estimated excess separate from measured leftovers, spoilage and plate waste.
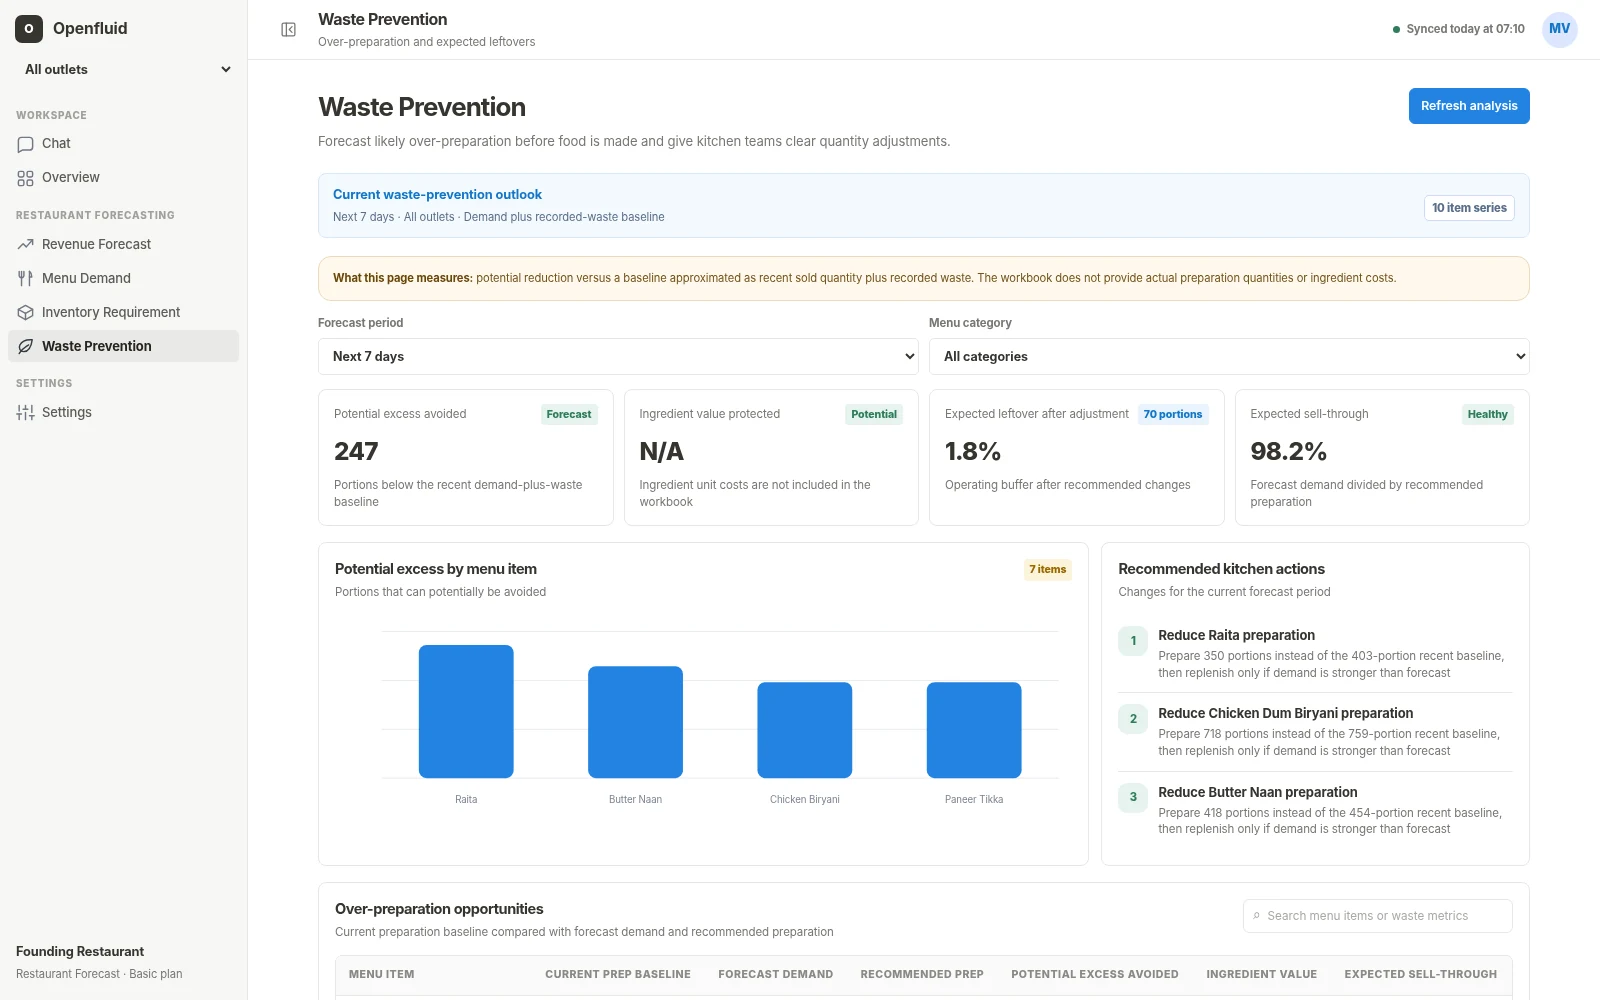
The difference between the current preparation baseline and the new recommended preparation quantity. This is an opportunity estimate, not proof that waste occurred.
The amount by which recommended preparation may still exceed forecast demand. This can be intentional when service risk justifies a buffer.
What the kitchen counted or weighed after service, classified by reason: unserved food, spoilage, trim, cooking error, return or plate waste.
The attached synthetic dataset records 42.8 portions of waste against 716 portions sold, an observed waste share of roughly 5.6% of sold-plus-wasted quantity. That does not prove forecast error. The next step is to split waste by reason and service period.
Other sample items show different patterns: Chocolate Brownie is approximately 7.6%, Paneer Biryani 7.1%, and Kadai Paneer 4.3%. These are synthetic observations, not claimed customer outcomes.
Forecast demand, propose preparation quantity and show the buffer. The kitchen can accept or override the plan with a reason.
Record material events such as a large booking, aggregator promotion, stockout or equipment issue that may invalidate the original plan.
Capture actual sales, remaining prepared quantity and waste by reason. Do not infer all unsold food as waste.
Separate recurring forecast bias from execution causes. Adjust buffers, recipes, batch sizes or data quality rules accordingly.
This compares two preparation plans using the same demand forecast and business rules.
This requires actual preparation, leftover and waste records. A forecast alone cannot establish realised avoidance.
Move from one large opening batch to smaller service batches when demand uncertainty is high.
Use different buffers by item based on holding life, service criticality and forecast error.
Flag an item whose ingredient shortage may cause substitution and make the original preparation plan obsolete.
Compare planned, prepared, sold, leftover and wasted quantities so recurring bias becomes visible.
Only when recipe cost, actual avoided quantity and a defensible counterfactual are available. The product should label ingredient value protected as an estimate until actual preparation and waste measurement support the claim.
Plate waste requires separate capture and is influenced by portion size, quality and customer behaviour. It should not be inferred from POS sales or kitchen leftovers.
Use the operational unit that can be consistently measured (portions, kilograms, litres or pieces) and maintain reliable conversion rules for financial reporting.
No. Some items need a small service buffer because the cost of a stockout exceeds the cost of limited leftover. The target should reflect holding life and service impact.
Start with preparation plans, actual leftovers and a simple waste-reason log for a small set of high-volume items.